Jordan Halsey — Los Feliz to Vernon, since 1993
Jordan Halsey — Los Feliz to Vernon, since 1993
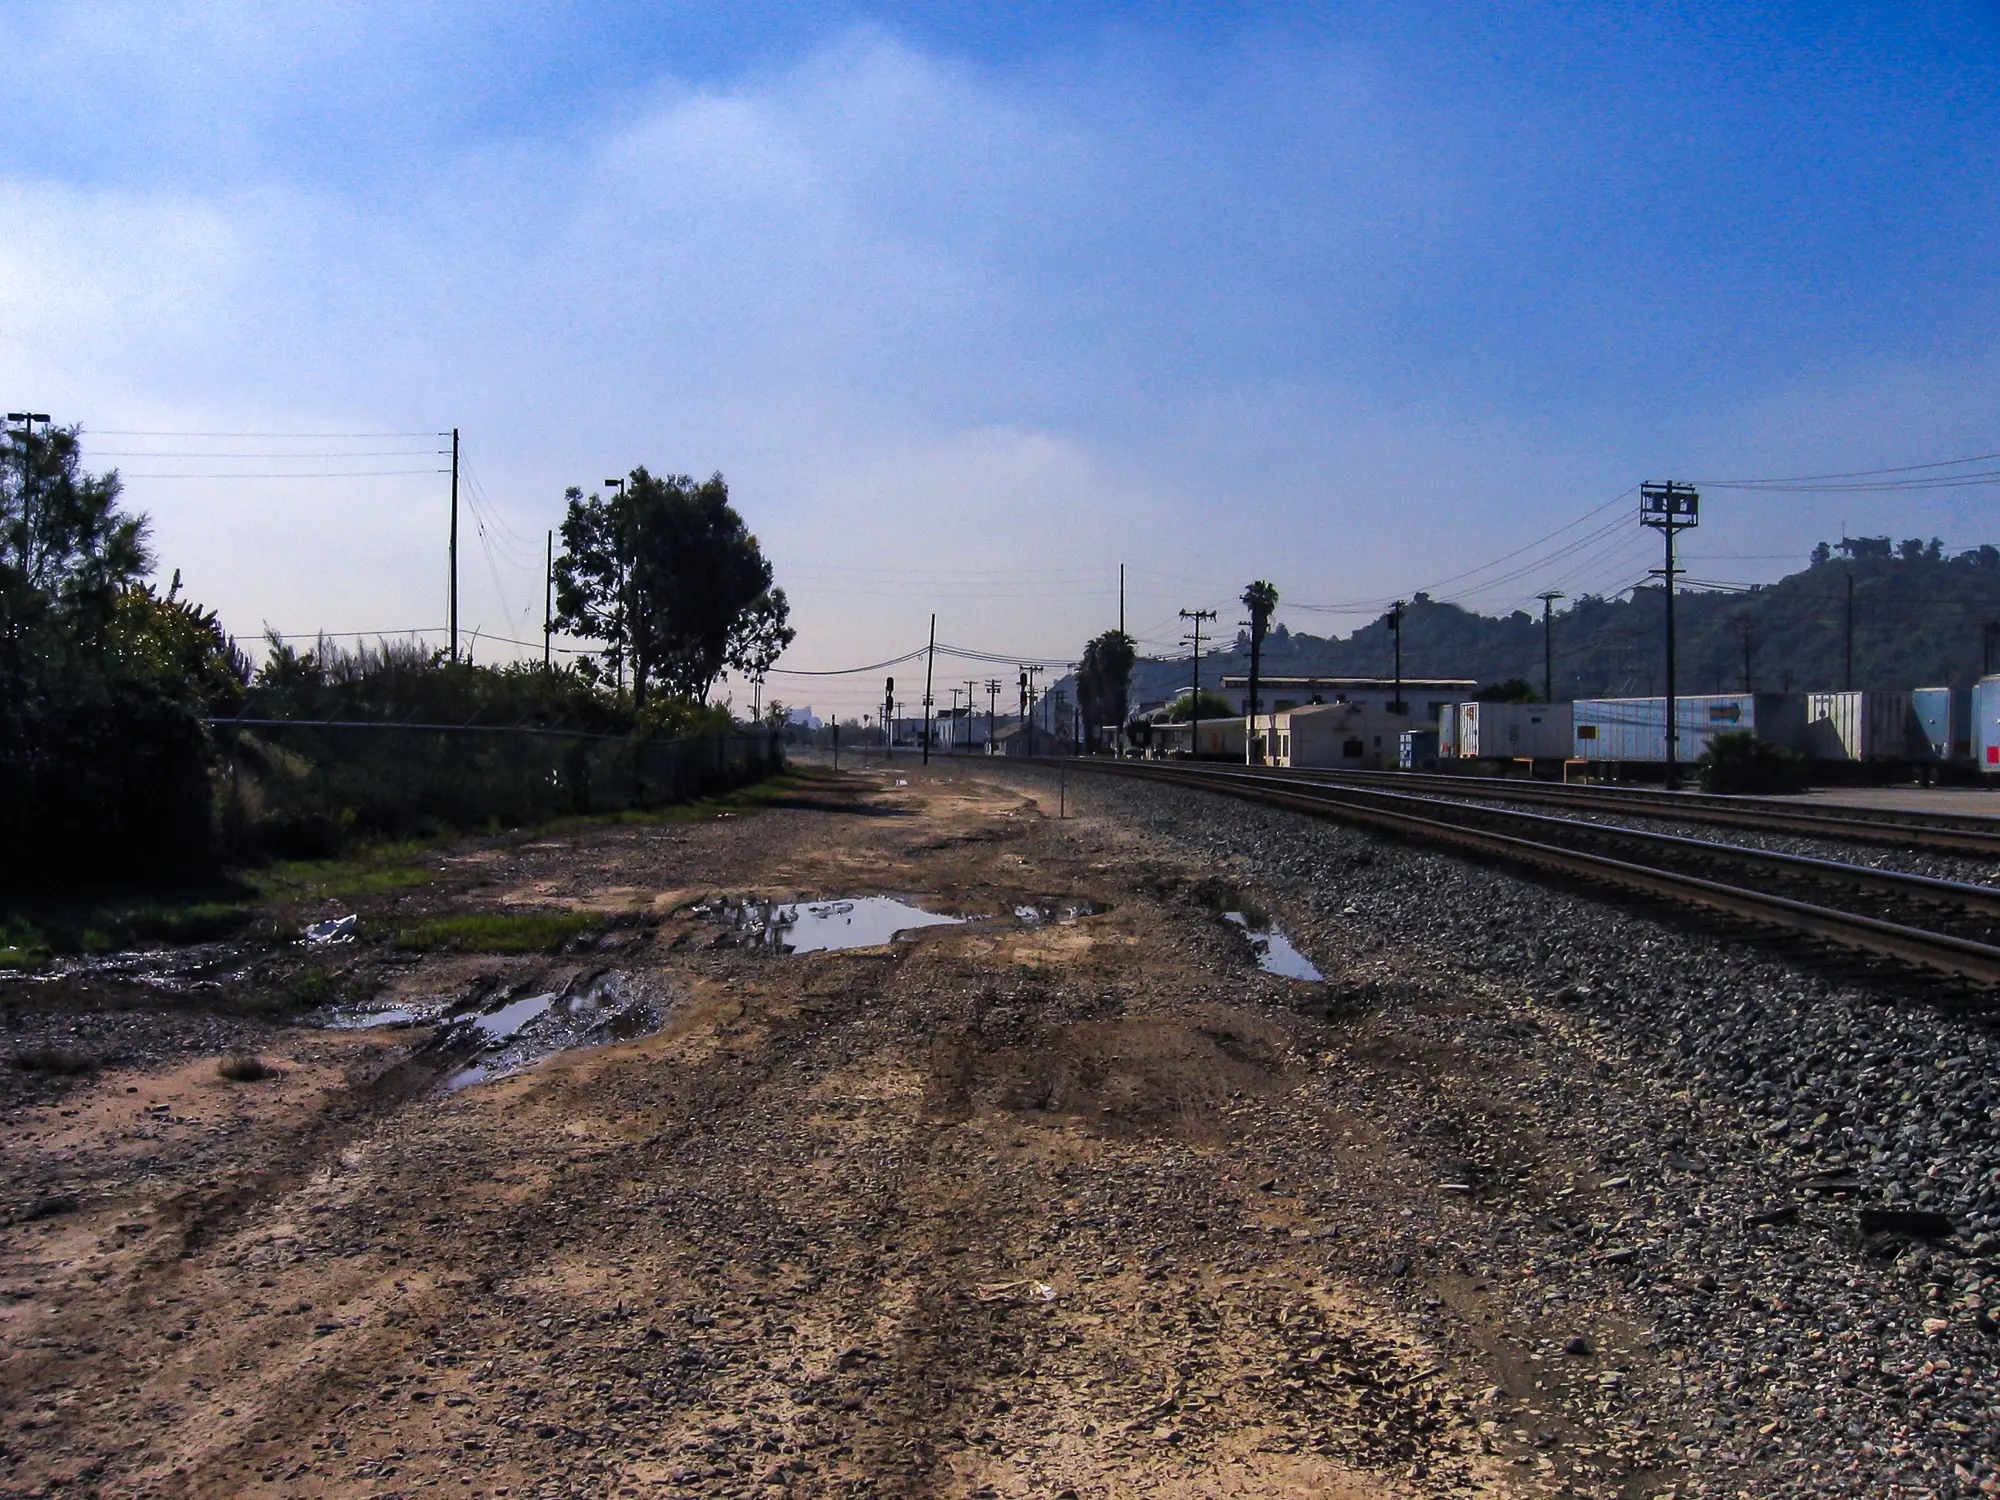
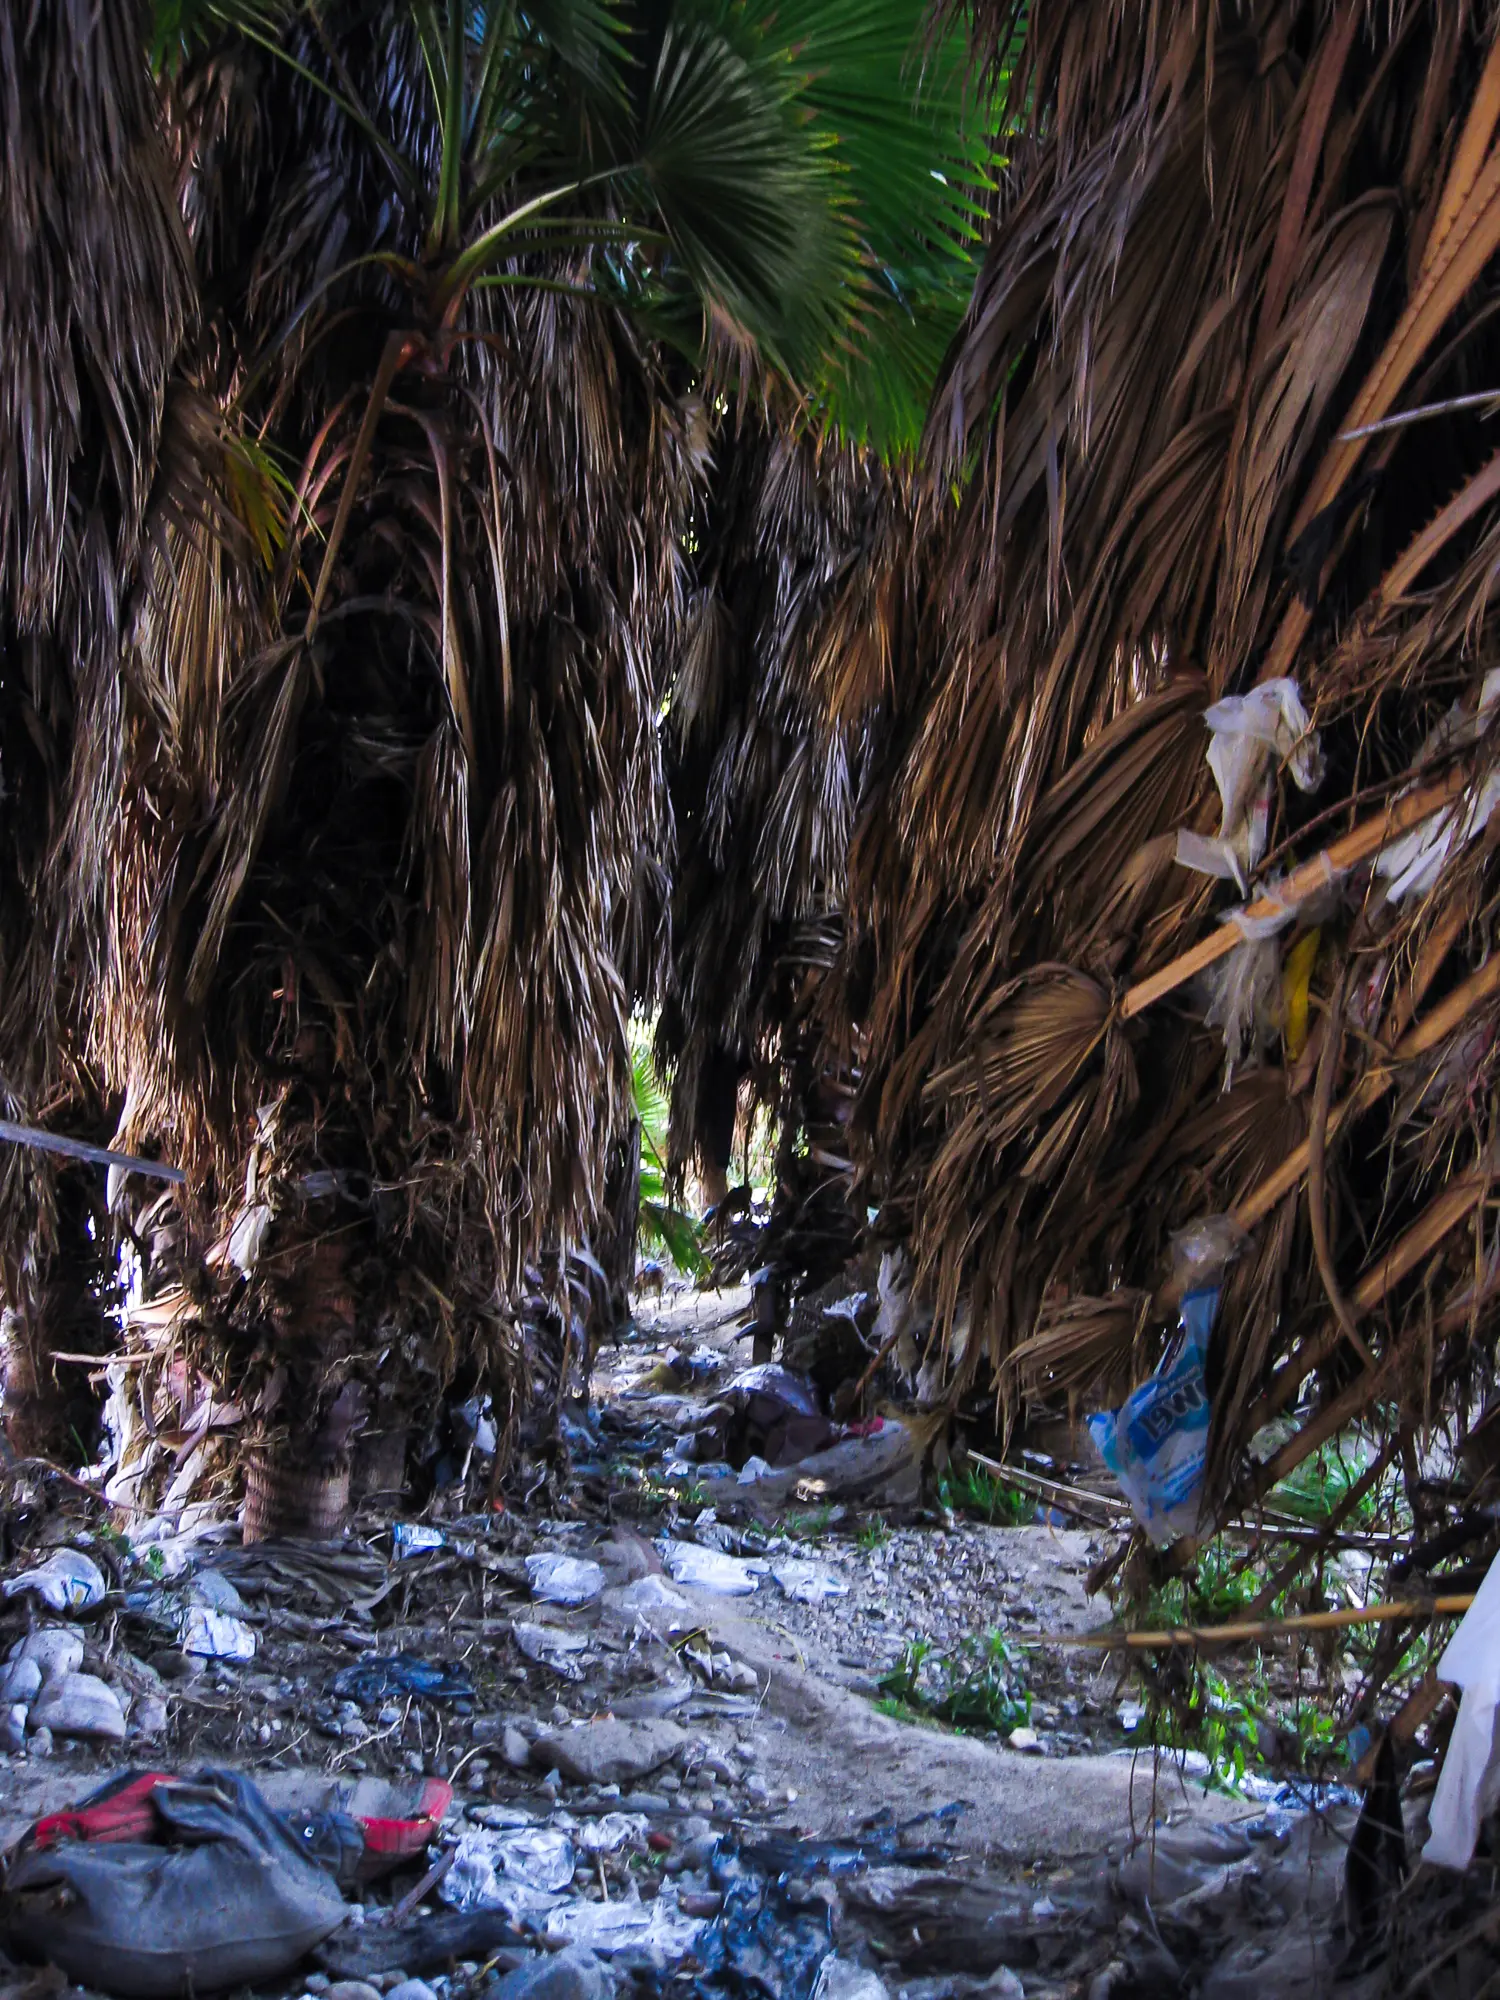
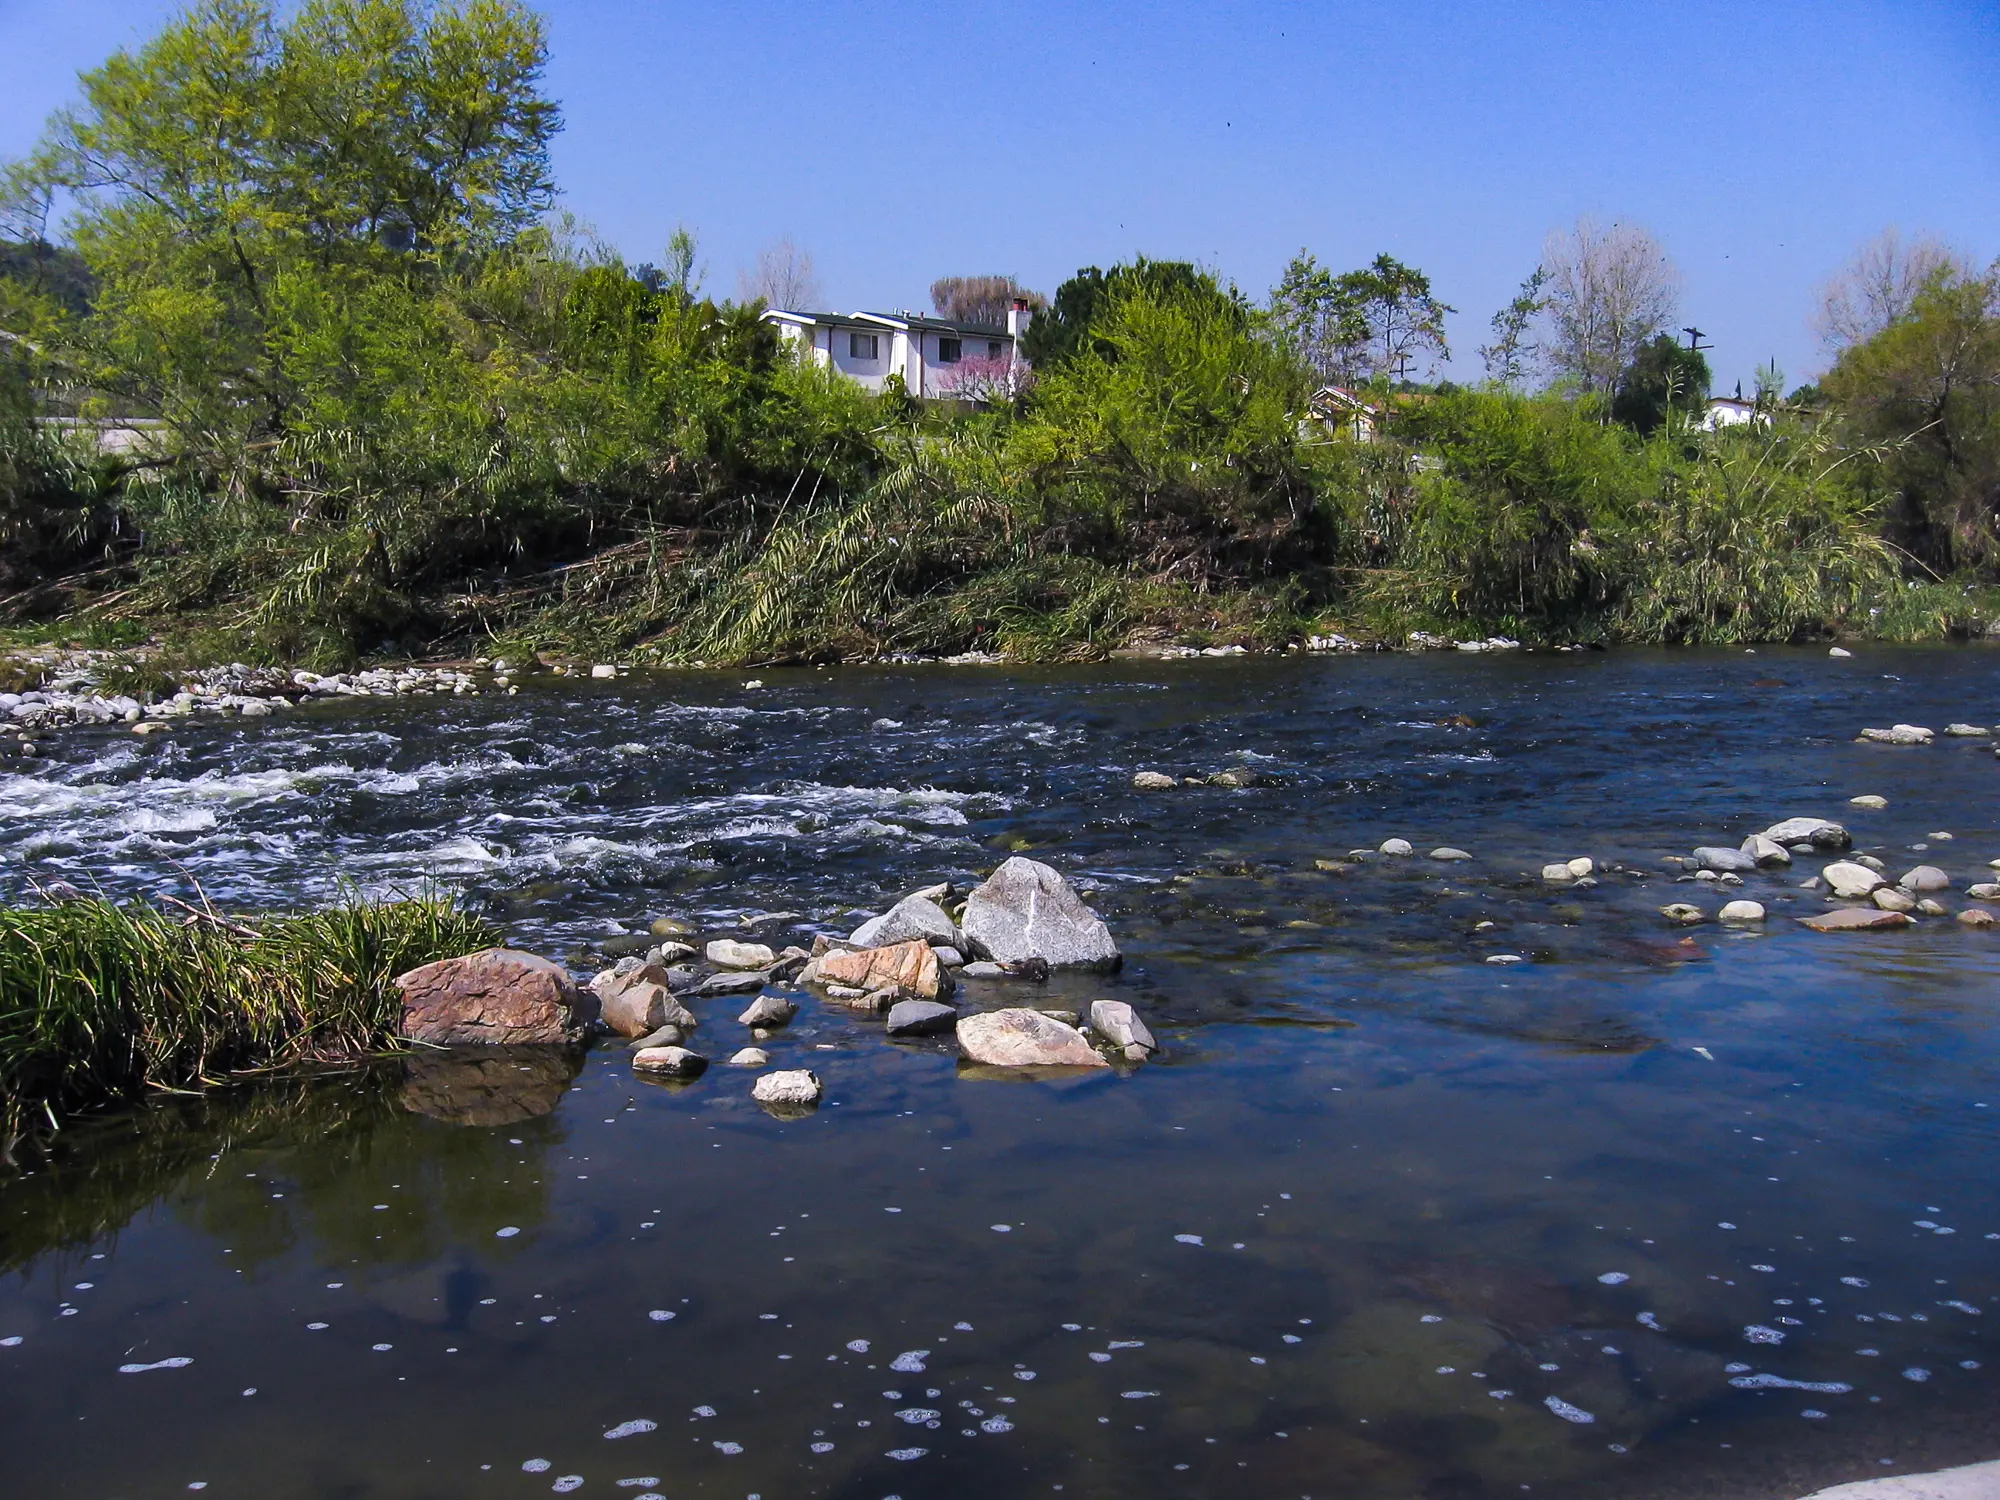
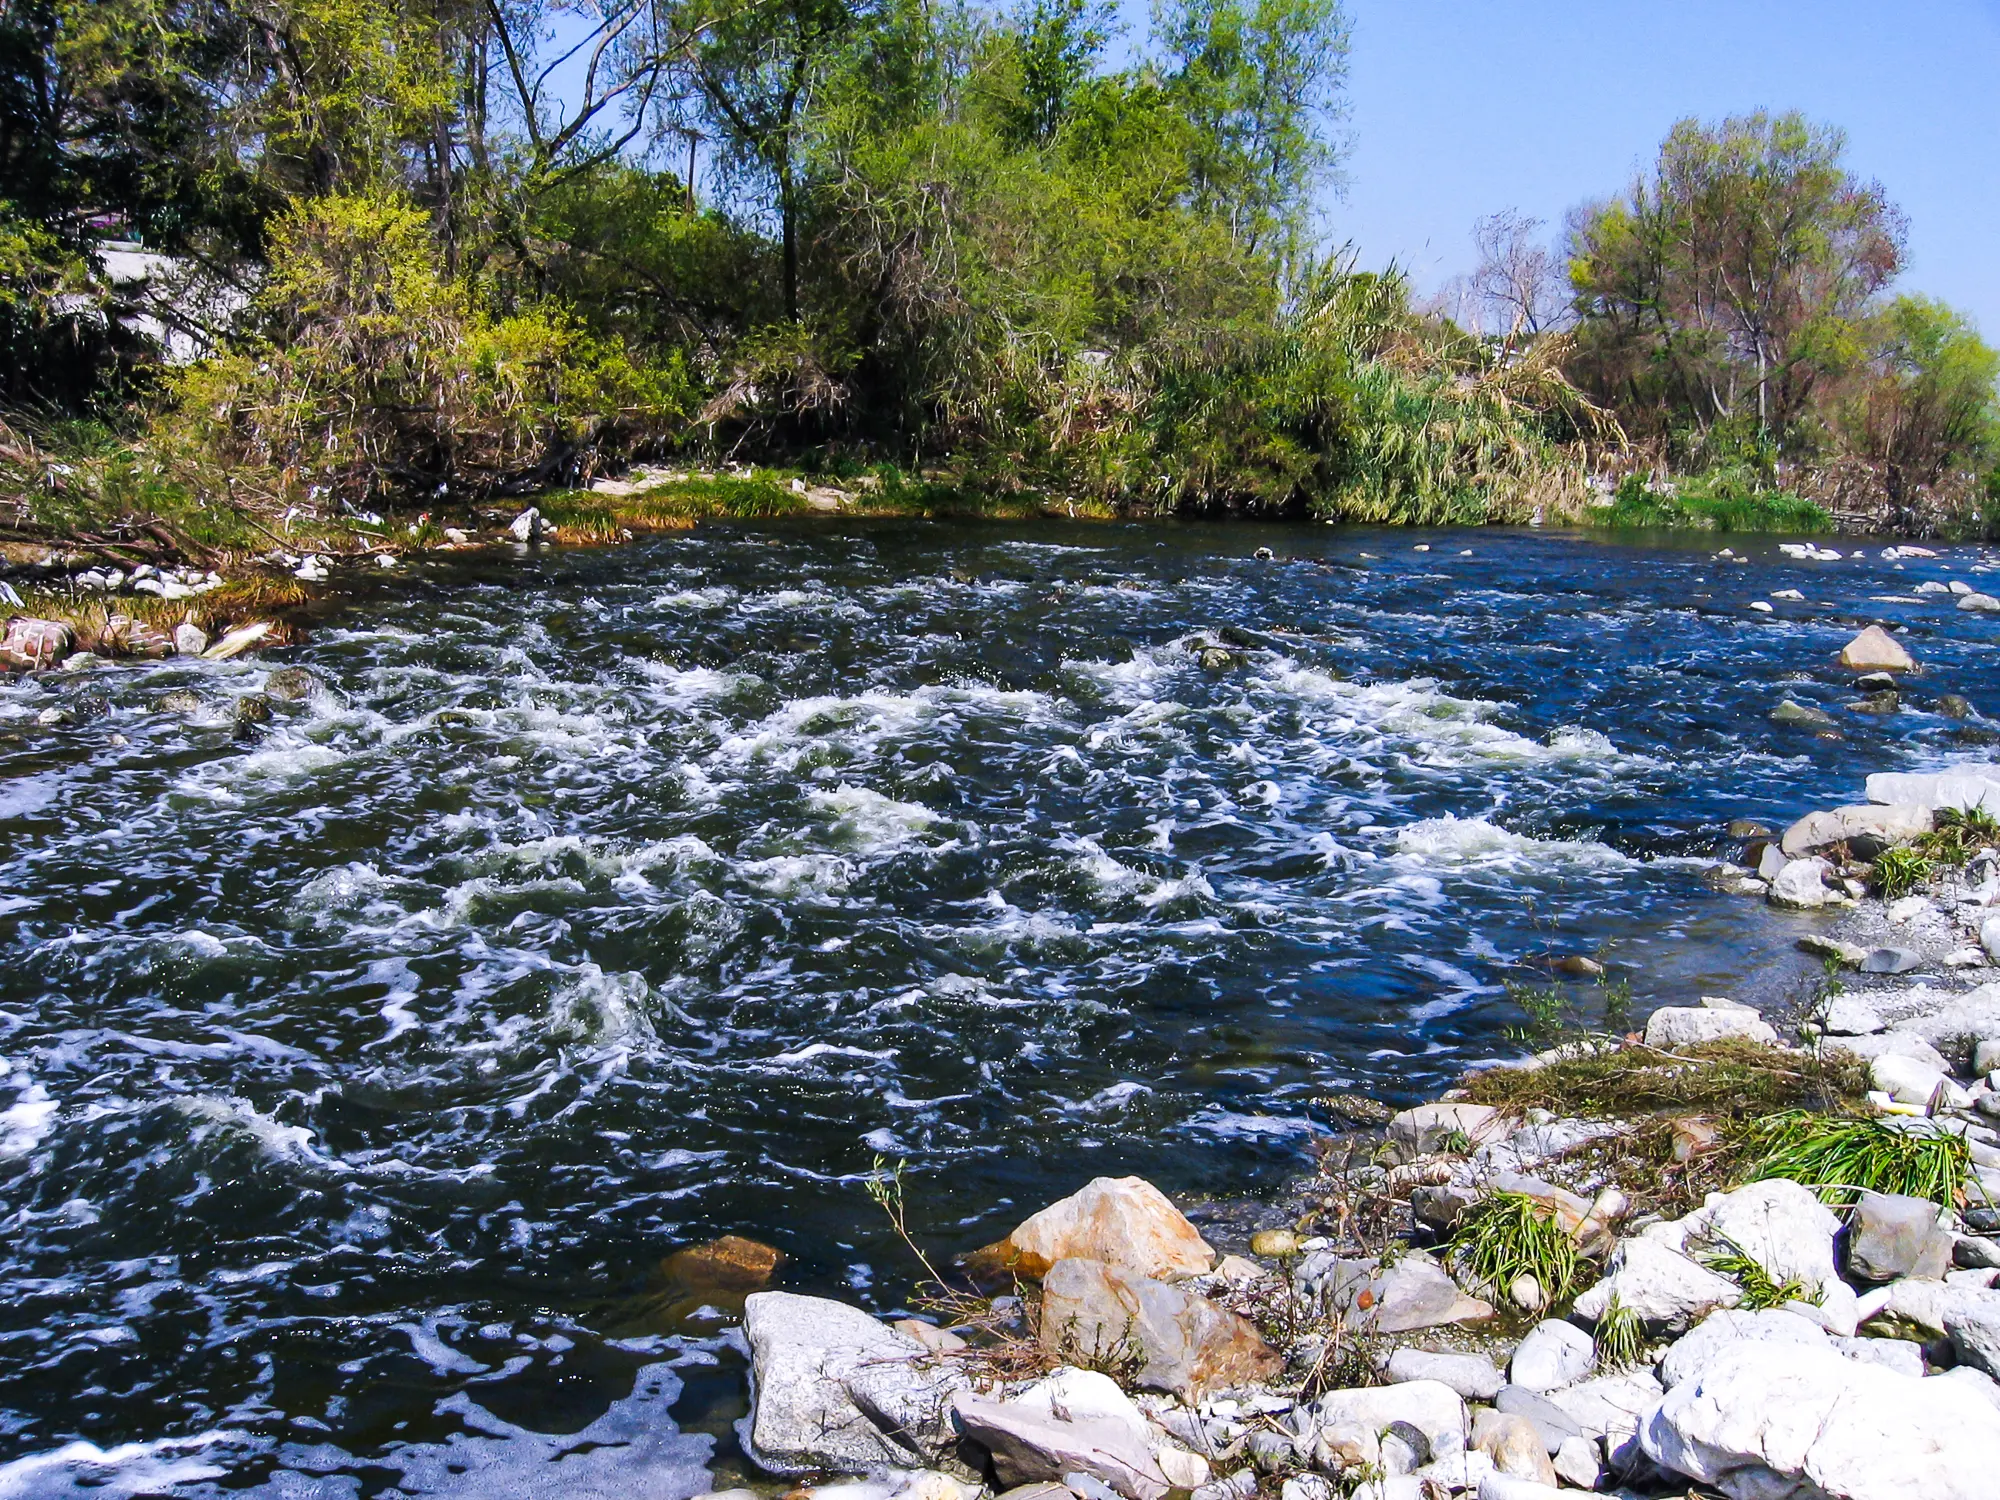
[Draft — Jordan's voice.] Thirty years of documenting the river between the Los Feliz overpass and Vernon: the bridges, the storms, the islands that appear and vanish, and the neighborhoods changing along the banks.
Alongside the photographs: photogrammetry of river detritus, real-time flow analysis, and public data scraped and reshaped to describe the river's corridor.
Series
Data
A river is infrastructure, and infrastructure leaves records. This project charts the public data of the LA River's city — water, money, housing, people.
First: half a century of where LA's water actually comes from.
Where LA's water comes from
LADWP supply by source, acre-feet per fiscal year, 1970–2018 · Source: LADWP
The LA Aqueduct carried four-fifths of the city's water in the early 1970s. Environmental rulings on Mono Lake and the Owens Valley cut its share; purchased MWD imports filled the gap. Recycled water appears in 1990 — and is still under 2%.
The same stretch I photograph — Griffith Park down to Downtown — during the foreclosure years.
The pattern holds everywhere: a 2015 peak, a 2017 collapse, a partial return by 2019. The residential river neighborhoods carried it; Downtown barely registered.
Registered foreclosures, river-corridor ZIP codes
Ordered downstream, Griffith Park → Downtown · shared scale · Source: City of LA registered-foreclosure filings
ZIP-level approximation. The filings carry parcel APNs and addresses, so this can be sharpened to actual river distance.
Everything above is history. This is live — the LA River's flow at Sepulveda Dam, straight from the USGS gauge, refreshing every five minutes.
In summer it's a trickle of treated water. After a storm it can rise a thousandfold in hours. The same feed drives the projection installation.
Streamflow, last 24 hours
USGS 11092450 · Los Angeles River at Sepulveda Dam · updates every 15 min ·